Analytics
Gain deep insights into your AI agent performance with comprehensive analytics. Track conversation volume, measure user satisfaction, monitor response times, and identify trends that help you optimize your agents and improve user experience.
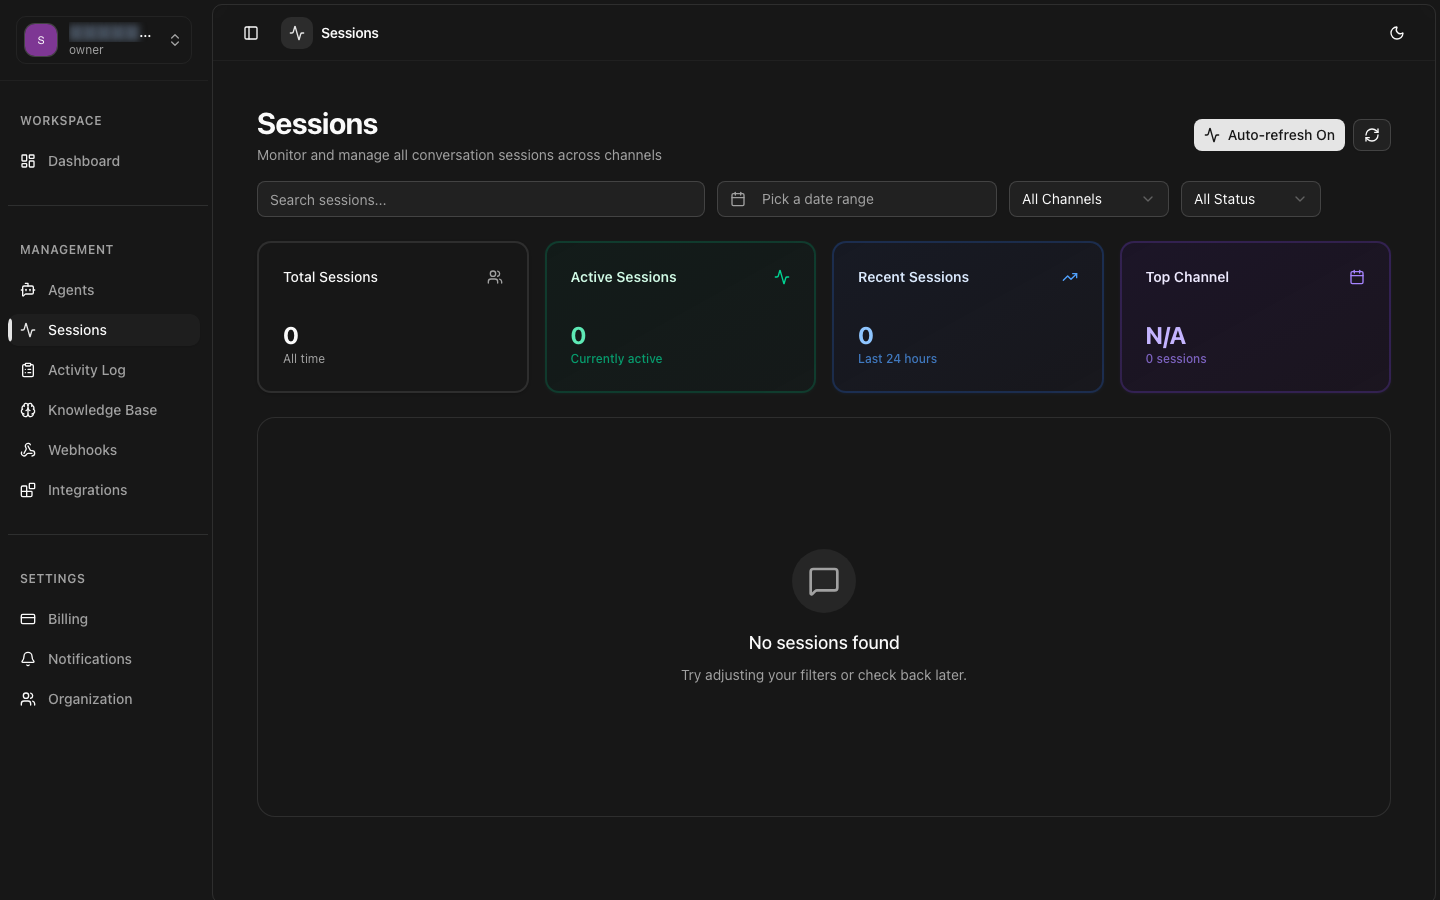
Metrics Dashboard
Real-time and historical metrics at a glance with interactive charts
Satisfaction Tracking
CSAT scores, NPS, and sentiment analysis across all conversations
Trends & Insights
Identify patterns, peak hours, and emerging topics automatically
Response Times
Track latency, response time distribution, and SLA compliance
Channel Distribution
Volume breakdown by channel, agent, and session type
Reports
Scheduled exports and custom report builder for stakeholders
Overview
The Analytics dashboard provides a comprehensive view of your conversation data through interactive visualizations and aggregate metrics. Data is updated in near real-time with a maximum latency of 60 seconds. All metrics can be filtered by date range, agent, channel, and other dimensions.
Data Freshness
Metrics are computed from the session event stream with a processing pipeline that aggregates data in one-minute windows. The analytics dashboard displays the most recent complete minute of data, ensuring consistency across all visualizations.
Time Ranges
All charts and metrics support configurable time ranges: Last Hour, Last 24 Hours, Last 7 Days, Last 30 Days, Last 90 Days, Last 12 Months, and Custom date ranges. Historical data is available based on your data retention policy.
Granularity
Chart granularity automatically adjusts based on the selected time range: per-minute for last hour, per-hour for last 24 hours, per-day for last 7-30 days, per-week for last 90 days, and per-month for longer ranges.
Data Export
Export the underlying data for any chart or metric by clicking the export button. Downloads are available in CSV and JSON formats with the current filter context applied.
Metrics Dashboard
The metrics dashboard displays key performance indicators in a grid of interactive cards. Each metric card shows the current value, a sparkline trend, and percentage change compared to the previous period.
Core Metrics
Total Conversations
24,847
+12.5% vs last period
Total number of sessions in the selected time period. Includes all statuses (completed, failed, cancelled).
Avg. Satisfaction
4.2 / 5.0
+0.3 vs last period
Average CSAT score across all rated conversations. Based on post-conversation user feedback ratings.
Avg. Response Time
1.2s
-0.3s vs last period
Average time for the agent to generate and send a response after receiving a user message. Measured in seconds.
Resolution Rate
87.3%
+2.1% vs last period
Percentage of conversations that were resolved without requiring human handoff. Higher is better.
Volume Metrics
Understand your conversation volume patterns with detailed breakdowns.
By Channel
By Status
By Session Type
Conversation Volume Chart
The volume chart shows the number of conversations over time, broken down by channel or status. Use this chart to identify peak usage periods and plan capacity.
Chart Controls:
- Group By: Switch between channel, status, agent, or session type breakdowns
- Stack Mode: Toggle between stacked area and individual line views
- Zoom: Click and drag to zoom into a specific time range
- Export: Download chart data as CSV or PNG image
User Satisfaction
Track and analyze user satisfaction across all conversations. Satisfaction data is collected through post-conversation surveys, thumbs-up/down ratings, and automated sentiment analysis on conversation transcripts.
Satisfaction Metrics
CSAT Score
Customer Satisfaction Score based on post-conversation surveys (1-5 scale). Users are prompted to rate their experience after each conversation.
NPS
Net Promoter Score measuring how likely users are to recommend your AI agent. Based on the standard 0-10 scale with Promoters, Passives, and Detractors.
Sentiment Score
Automated sentiment analysis on conversation transcripts. Scores range from -1.0 (very negative) to +1.0 (very positive). Analyzed using NLP models.
Escalation Rate
Percentage of conversations that required escalation to a human agent. A high escalation rate may indicate issues with agent configuration or knowledge base.
Satisfaction Trends
Track how satisfaction metrics change over time and correlate with configuration changes, new deployments, or external factors.
Trend Analysis Features:
- Trend Lines: Overlay trend lines on satisfaction charts to identify direction
- Anomaly Detection: Automatic alerts when satisfaction drops below threshold
- Correlation Analysis: Compare satisfaction with response time, resolution rate, and other metrics
- Segment Comparison: Compare satisfaction across channels, agents, and user segments
Satisfaction API
Access satisfaction metrics programmatically for integration with external reporting systems or custom dashboards.
Survey Configuration
Trends & Insights
The Trends section analyzes historical data to identify patterns, predict future volumes, and surface actionable insights about your agent performance and user behavior.
Trend Analysis
Volume Forecasting
ML-powered forecasting predicts conversation volumes for the next 7, 30, and 90 days based on historical patterns, day-of-week effects, and seasonal trends.
Peak Hour Analysis
Identify the busiest hours and days for each channel. Use this data to schedule maintenance during low-traffic periods and allocate resources effectively.
Topic Clustering
Automatically discovered conversation topics and their volume trends. Helps identify emerging issues, popular features, and knowledge base gaps.
Anomaly Alerts
Automatic detection of unusual patterns: sudden volume spikes, error rate increases, or satisfaction drops. Alerts are sent via notification and email.
Comparison Charts
Compare performance across different time periods, agents, channels, or custom segments. Comparison charts support side-by-side and overlay views.
| Metric | Current Period | Previous Period | Change | Trend |
|---|---|---|---|---|
| Sessions | 24,847 | 22,086 | +12.5% | ↑ |
| Avg. Duration | 4m 32s | 5m 12s | -12.8% | ↓ |
| Response Time | 1.2s | 1.5s | -20.0% | ↓ |
| CSAT Score | 4.2 | 3.9 | +7.7% | ↑ |
| Resolution Rate | 87.3% | 85.2% | +2.1% | ↑ |
Reports
Generate, schedule, and share comprehensive analytics reports. The reports engine supports custom metric selection, multiple visualization types, and delivery automation.
Report Types
Performance Summary
High-level overview of key metrics: total sessions, satisfaction, response times, resolution rate, and top channels. Ideal for weekly team updates.
Agent Comparison
Side-by-side comparison of all active agents with performance rankings, trend indicators, and improvement suggestions.
Compliance Report
Detailed report for compliance and audit purposes. Includes session logs, data retention status, access records, and intervention history.
Custom Report
Build fully customized reports by selecting specific metrics, dimensions, filters, and visualization types. Save report templates for reuse.
Report Scheduling
Schedule reports to be generated automatically and delivered via email, webhook, or stored in cloud storage (S3, GCS, Azure Blob).
Report API
Generate reports on-demand programmatically and retrieve results as downloadable files.
Report Limits